
Samples of My Featured Projects
Let's analyse the data derived from Google Analytics statistics for the company I work for. Learn the way social media marketing has increased website traffic, user engagement, and business growth.

Period 2: July 1-December 31, 2023
Period 1: January 1–June 30, 2023
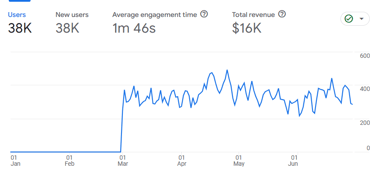
Period 1: January 1–June 30, 2023
Total Users: 38,000
New Users: 38,000
Average Engagement Time: 1 minute 46 seconds
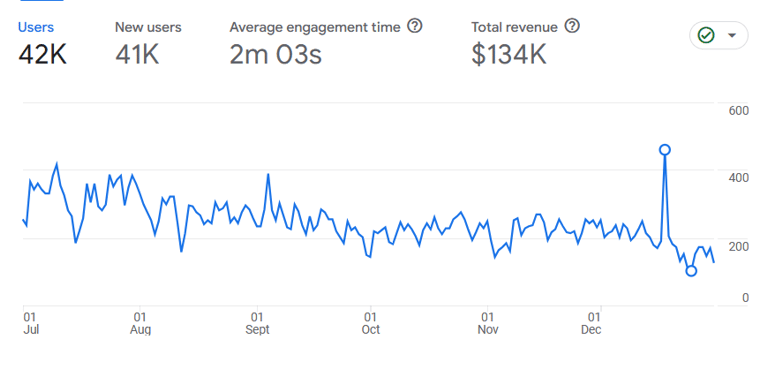
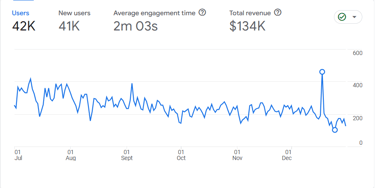
Period 2: July 1-December 31, 2023
Total Users: 42,000
New Users: 41,000
Average Engagement Time: 2 minutes 03 seconds
Analysis:
User Growth:
There has been a significant increase in both total users and new users from the first period to the second period. This suggests that the digital marketing strategies have proven successful in drawing in a greater number of users to the website.
Engagement Improvement
From the first to the second period, there has also been a noticeable improvement in the average engagement time. This implies that the users spend an increased amount of time on the website, which could indicate improvements in content quality or user experience.
Overall Performance
The website's performance has shown significant growth according to these statistics. The increase in both user numbers and engagement time suggests that the digital marketing strategies implemented have proven effective in attracting traffic and appealing users.
Areas of Focus
It might be helpful to keep an eye on these numbers and pinpoint opportunities for improvement. This could involve analysing user behaviour on the website, optimising content for improved engagement, and identifying opportunities for user retention and conversion.
With Google Analytics analytics, you can improve the way you use digital marketing by increasing website visibility and traffic.